swmm.pandas.Output.link_series
-
Output.link_series(link, attribute=
('flow_rate', 'flow_velocity', 'flow_depth'), start=None, end=None, columns='attr', asframe=True)[source]¶ Get one or more time series for one or more link attributes. Specify series start index and end index to get desired time range.
- Parameters
- link: Union[int, str, Sequence[Union[int, str]], None]
The link index or name.
- attribute: Union[int, str, Enum, Sequence[Union[int, str, Enum]], None]
The attribute index or name.
On of:
flow_rate, flow_depth, flow_velocity, flow_volume, capacity.
defaults to: (‘flow_rate’,’flow_velocity’,’flow_depth’)
Can also input the integer index of the attribute you would like to pull or the actual enum from output.link_attributes.
Setting to None indicates all attributes.
- start_index: Union[str,int, datetime, None], optional
The start datetime or index of from which to return series, defaults to None.
Setting to None indicates simulation start.
- end_index: Union[str,int, datetime, None], optional
The end datetime or index of from which to return series, defaults to None.
Setting to None indicates simulation end.
- columns: Optional[str], optional
Decide whether or not to break out elements or attributes as columns. May be one of:
None: Return long-form data with one column for each data point
‘elem’: Return data with a column for each element. If more than one attribute are given, attribute names are added to the index.
‘attr’: Return data with a column for each attribute. If more than one element are given, element names are added to the index.
defaults to ‘attr’.
- asframe: bool
A switch to return an indexed DataFrame. Set to False to get an array of values only, defaults to True.
- Returns
- Union[pd.DataFrame,np.ndarray]
A DataFrame or ndarray of attribute values in each column for requested date range and links.
Examples
Pull flow rate for two conduits
>>> from swmm.pandas import Output,test_out_path
>>> out = Output(test_out_path)
>>> out.link_series(['COND1','COND6'],out.link_attributes.FLOW_RATE,columns='elem')
                        COND1   COND6
datetime
1900-01-01 00:05:00  0.000031  0.0000
1900-01-01 00:10:00  0.000280  0.0000
1900-01-01 00:15:00  0.000820  0.0000
1900-01-01 00:20:00  0.001660  0.0000
1900-01-01 00:25:00  0.002694  0.0000
...                       ...     ...
1900-01-01 23:40:00  0.037800  1.5028
1900-01-01 23:45:00  0.037800  1.5028
1900-01-01 23:50:00  0.037800  1.5028
1900-01-01 23:55:00  0.037800  1.5028
1900-01-02 00:00:00  0.037800  1.5028
[288 rows x 2 columns]
Pull a wide-form dataframe for all parameters for a link
>>> out.node_series('COND1', out.link_attributes)
                    flow_rate  flow_depth  flow_velocity  flow_volume  capacity  groundwater  pol_rainfall        sewage
datetime
1900-01-01 00:05:00   0.000031    0.053857       0.001116    23.910770  0.024351    79.488449      0.000000  0.000000e+00
1900-01-01 00:10:00   0.000280    0.134876       0.004258    76.354103  0.080857    93.174545      0.000000  0.000000e+00
1900-01-01 00:15:00   0.000820    0.165356       0.009518    99.407425  0.108456    91.125893      0.000000  0.000000e+00
1900-01-01 00:20:00   0.001660    0.188868       0.016023   117.895081  0.131204    88.518318      0.000000  0.000000e+00
1900-01-01 00:25:00   0.002694    0.206378       0.022971   131.773941  0.148936    86.187752      0.000000  0.000000e+00
...                        ...         ...            ...          ...       ...          ...           ...           ...
1900-01-01 23:40:00   0.037800    0.312581       0.180144   212.443344  0.267168    31.683731     68.344780  6.173063e-08
1900-01-01 23:45:00   0.037800    0.312581       0.180144   212.443344  0.267168    31.788561     68.242958  5.872794e-08
1900-01-01 23:50:00   0.037800    0.312581       0.180144   212.443344  0.267168    31.890982     68.144737  5.583060e-08
1900-01-01 23:55:00   0.037800    0.312581       0.180144   212.443344  0.267168    31.988274     68.052620  5.311425e-08
1900-01-02 00:00:00   0.037800    0.312581       0.180144   212.443344  0.267168    32.083355     67.963829  5.049533e-08
[288 rows x 8 columns]
Pull a long-form dataframe of all links and attributes
>>> out.node_series(out.links, out.link_attributes, columns=None)
                            flow_rate  flow_depth  flow_velocity  flow_volume  capacity  groundwater  pol_rainfall    sewage
datetime            element
1900-01-01 00:05:00 COND1     0.000031    0.053857       0.001116    23.910770  0.024351    79.488449      0.000000   0.00000
1900-01-01 00:10:00 COND1     0.000280    0.134876       0.004258    76.354103  0.080857    93.174545      0.000000   0.00000
1900-01-01 00:15:00 COND1     0.000820    0.165356       0.009518    99.407425  0.108456    91.125893      0.000000   0.00000
1900-01-01 00:20:00 COND1     0.001660    0.188868       0.016023   117.895081  0.131204    88.518318      0.000000   0.00000
1900-01-01 00:25:00 COND1     0.002694    0.206378       0.022971   131.773941  0.148936    86.187752      0.000000   0.00000
...                                ...         ...            ...          ...       ...          ...           ...       ...
1900-01-01 23:40:00 WR1       0.000000    0.000000       0.000000     0.000000  1.000000    15.293419     39.303375  45.43092
1900-01-01 23:45:00 WR1       0.000000    0.000000       0.000000     0.000000  1.000000    15.313400     39.292118  45.43092
1900-01-01 23:50:00 WR1       0.000000    0.000000       0.000000     0.000000  1.000000    15.333243     39.281300  45.43092
1900-01-01 23:55:00 WR1       0.000000    0.000000       0.000000     0.000000  1.000000    15.352408     39.271194  45.43092
1900-01-02 00:00:00 WR1       0.000000    0.000000       0.000000     0.000000  1.000000    15.371475     39.261478  45.43092
[2304 rows x 8 columns]
Pull flow timeseries and pollutant tracer concentrations for a link and plot
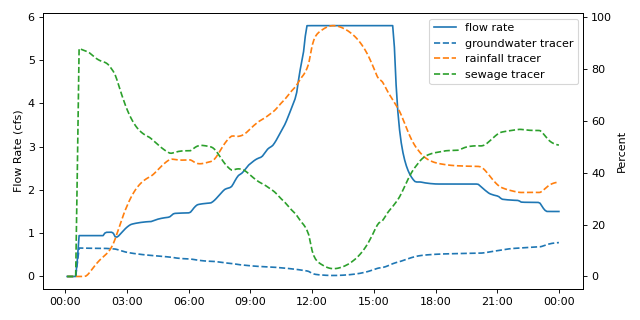
import matplotlib.pyplot as plt
import matplotlib.dates as mdates
from swmm.pandas import Output,test_out_path

out = Output(test_out_path)
df = out.link_series('COND6',['flow_rate','groundwater','pol_rainfall','sewage'])

# set up figure
fig,ax = plt.subplots(figsize=(8,4))

# plot flow rate on primary yaxis
ax.plot(df.flow_rate,label="flow rate")

# plot pollutant concentrations on secondary axis
# rainfall, DWF, and groundwater were given 100 mg/L pollutant
# concentrations to serve as tracers
ax1 = ax.twinx()
ax1.plot(df.groundwater,ls = '--',label="groundwater tracer")
ax1.plot(df.pol_rainfall,ls = '--',label="rainfall tracer")
ax1.plot(df.sewage,ls = '--',label="sewage tracer")

# style axes
ax.set_ylabel("Flow Rate (cfs)")
ax.xaxis.set_major_formatter(mdates.DateFormatter("%H:%M"))
ax1.set_ylabel("Percent")

# add legend and show figure
fig.legend(bbox_to_anchor=(1,1),bbox_transform=ax.transAxes)
fig.tight_layout()

fig.show()