swmm.pandas.Output.subcatch_series
-
Output.subcatch_series(subcatchment, attribute=
('rainfall', 'runoff_rate', 'gw_outflow_rate'), start=None, end=None, columns='attr', asframe=True)[source]¶ Get one or more time series for one or more subcatchment attributes. Specify series start index and end index to get desired time range.
- Parameters
- subcatchment: Union[int, str, Sequence[Union[int, str]], None]
The subcatchment index or name.
- attribute: Union[int, str, Enum, Sequence[Union[int, str, Enum]], None],
The attribute index or name.
On of:
rainfall, snow_depth, evap_loss, infil_loss, runoff_rate, gw_outflow_rate, gw_table_elev, soil_moisture.
Defaults to: (‘rainfall’, ‘runoff_rate’, ‘gw_outflow_rate’).
Can also input the integer index of the attribute you would like to pull or the actual enum from Output.subcatch_attributes.
Setting to None indicates all attributes.
- start: Union[str,int, datetime, None], optional
The start datetime or index of from which to return series, defaults to None.
Setting to None indicates simulation start.
- end: Union[str,int, datetime, None], optional
The end datetime or index of from which to return series, defaults to None.
Setting to None indicates simulation end.
- columns: Optional[str], optional
Decide whether or not to break out elements or attributes as columns. May be one of:
None: Return long-form data with one column for each data point
‘elem’: Return data with a column for each element. If more than one attribute are given, attribute names are added to the index.
‘attr’: Return data with a column for each attribute. If more than one element are given, element names are added to the index.
defaults to ‘attr’.
- asframe: bool
A switch to return an indexed DataFrame. Set to False to get an array of values only, defaults to True.
- Returns
- Union[pd.DataFrame,np.ndarray]
A DataFrame or ndarray of attribute values in each column for requested date range and subcatchments.
Examples
Pull single time series for a single subcatchment
>>> from swmm.pandas import Output,test_out_path
>>> out = Output(test_out_path)
>>> out.subcatch_series('SUB1', 'runoff_rate')
                     runoff_rate
datetime
1900-01-01 00:05:00     0.000000
1900-01-01 00:10:00     0.000000
1900-01-01 00:15:00     0.000000
1900-01-01 00:20:00     0.000000
1900-01-01 00:25:00     0.000000
...                          ...
1900-01-01 23:40:00     0.025057
1900-01-01 23:45:00     0.025057
1900-01-01 23:50:00     0.025057
1900-01-01 23:55:00     0.025057
1900-01-02 00:00:00     0.025057
[288 rows x 1 columns]
Pull a wide-form dataframe for all parameters for a catchment
>>> out.subcatch_series('SUB1', out.subcatch_attributes)
                    rainfall  snow_depth  evap_loss  infil_loss  ...  soil_moisture  groundwater  pol_rainfall  sewage
datetime                                                          ...
1900-01-01 00:05:00   0.03000         0.0        0.0    0.020820  ...       0.276035          0.0           0.0     0.0
1900-01-01 00:10:00   0.03000         0.0        0.0    0.020952  ...       0.276053          0.0           0.0     0.0
1900-01-01 00:15:00   0.03000         0.0        0.0    0.021107  ...       0.276071          0.0           0.0     0.0
1900-01-01 00:20:00   0.03000         0.0        0.0    0.021260  ...       0.276089          0.0           0.0     0.0
1900-01-01 00:25:00   0.03000         0.0        0.0    0.021397  ...       0.276107          0.0           0.0     0.0
...                       ...         ...        ...         ...  ...            ...          ...           ...     ...
1900-01-01 23:40:00   0.03224         0.0        0.0    0.027270  ...       0.280026          0.0         100.0     0.0
1900-01-01 23:45:00   0.03224         0.0        0.0    0.027270  ...       0.280026          0.0         100.0     0.0
1900-01-01 23:50:00   0.03224         0.0        0.0    0.027270  ...       0.280026          0.0         100.0     0.0
1900-01-01 23:55:00   0.03224         0.0        0.0    0.027270  ...       0.280026          0.0         100.0     0.0
1900-01-02 00:00:00   0.00000         0.0        0.0    0.027270  ...       0.280026          0.0         100.0     0.0
[288 rows x 11 columns]
Pull a long-form dataframe of all catchments and attributes
>>> out.subcatch_series(out.subcatchments, out.subcatch_attributes, columns=None)
                                       result
datetime            element attribute
1900-01-01 00:05:00 SUB1    rainfall     0.03
1900-01-01 00:10:00 SUB1    rainfall     0.03
1900-01-01 00:15:00 SUB1    rainfall     0.03
1900-01-01 00:20:00 SUB1    rainfall     0.03
1900-01-01 00:25:00 SUB1    rainfall     0.03
...                                       ...
1900-01-01 23:40:00 SUB3    sewage       0.00
1900-01-01 23:45:00 SUB3    sewage       0.00
1900-01-01 23:50:00 SUB3    sewage       0.00
1900-01-01 23:55:00 SUB3    sewage       0.00
1900-01-02 00:00:00 SUB3    sewage       0.00
[9504 rows x 1 columns]
Pull two parameters for one subcatchment and plot the results
import matplotlib.pyplot as plt
from matplotlib.dates import DateFormatter
from swmm.pandas import Output,test_out_path

# read output file in Output object
out = Output(test_out_path)

# pull rainfall and runoff_rate timeseries and plot them
ax = out.subcatch_series('SUB1', ['rainfall', 'runoff_rate']).plot(figsize=(8,4))
plt.title("SUB1 Params")
plt.tight_layout()
plt.show()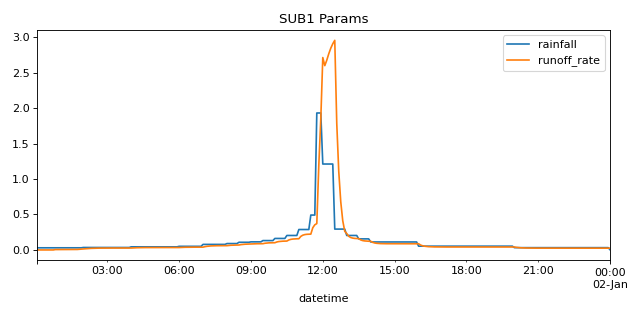
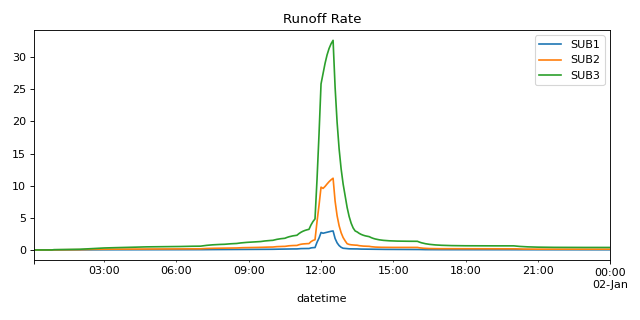
Pull the one parameter for all subcatchments
import matplotlib.pyplot as plt
from matplotlib.dates import DateFormatter
from swmm.pandas import Output,test_out_path

# read output file in Output object
out = Output(test_out_path)

# pull runoff_rate timeseries for all cathments and plot them
ax = out.subcatch_series(out.subcatchments, 'runoff_rate', columns='elem').plot(figsize=(8,4))
plt.title("Runoff Rate")
plt.tight_layout()
plt.show()